can i park
an iOS application that displays parking information for New York City using GeoJSON data obtained from the NYC Department of Transportation
summary
Can I Park is an iOS application in development that displays parking information for New York City using GeoJSON data obtained from the NYC Department of Transportation.
I built this app to get experience handling JSON data and third party APIs (the map function in the app uses the Google Maps iOS API)
This app is currently in progress. You can find the GitHub link here. Read on below if you want more details of my involvement.
I built this app for two main purposes – the first was to improve my iOS skills, and the second was to learn more about processing data in Python.
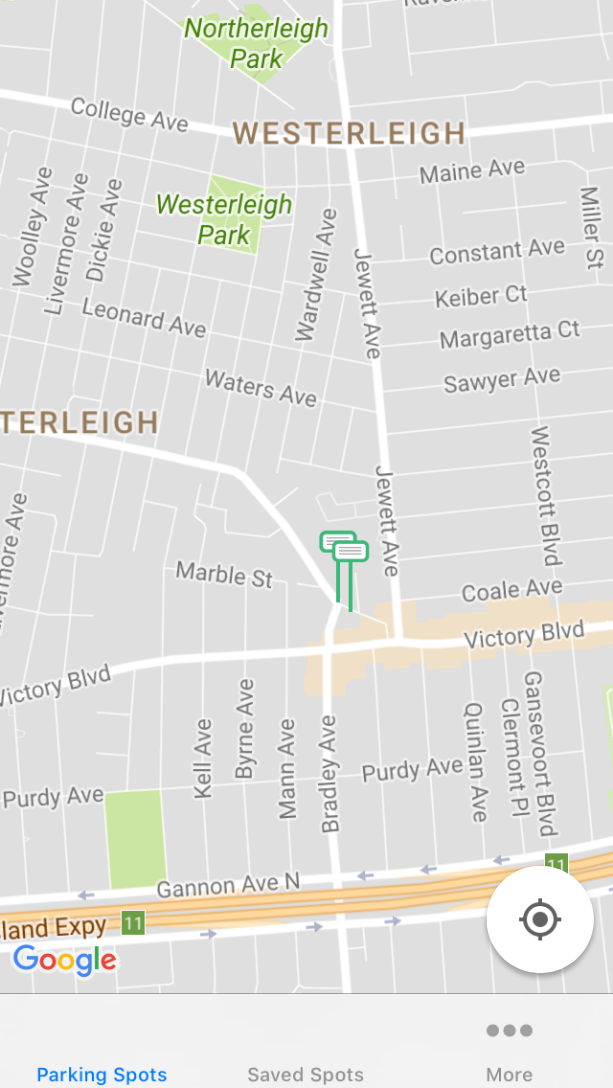
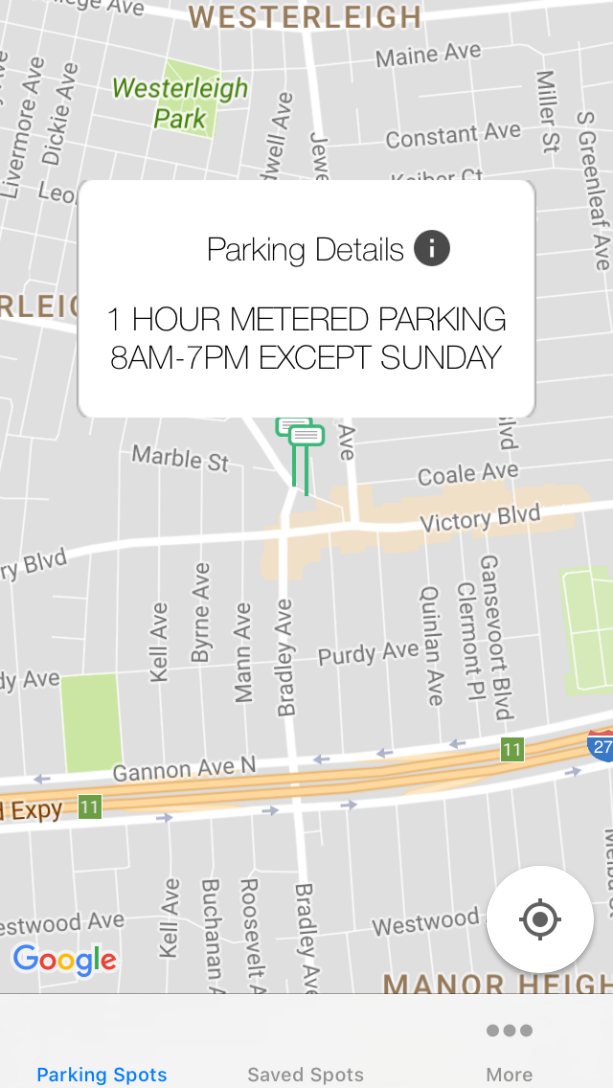
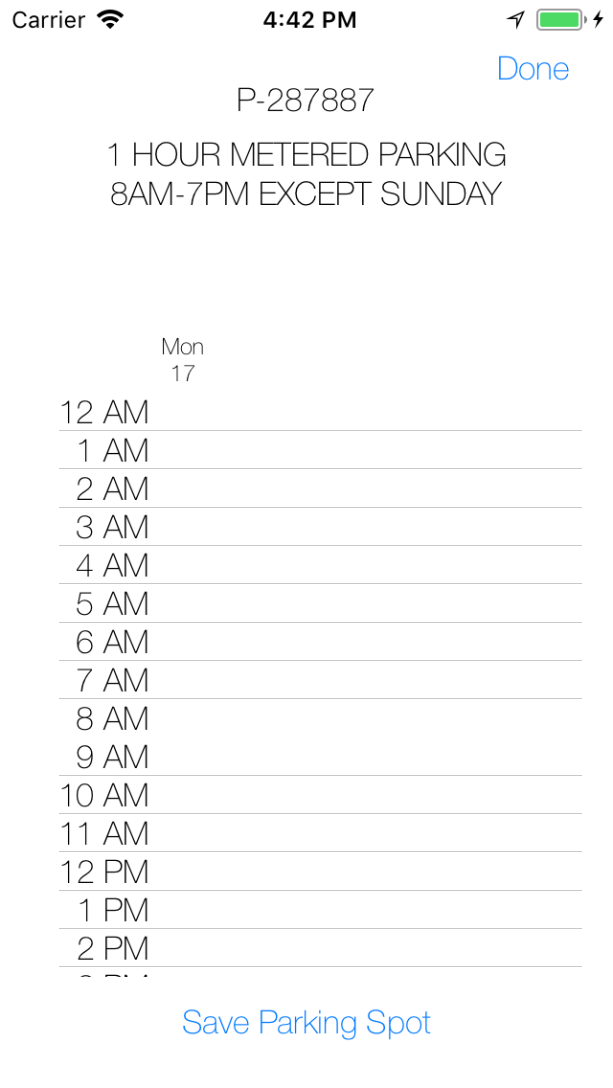
A lot of the parking sign data, like location coordinates, comes in a GeoJSON format. I used Swift to process this data and display it in my app. I overlayed some additional information, such as parking sign descriptions and a custom sign icon, over Google Maps, while learning about the Google Maps API in the meantime.
I also got to learn a lot about data processing and text parsing. This included using regex with complicated queries, and processing really messy data sets (manually entered data, messy notes, no data validation, TONS of edge cases, etc). This helped me get a better idea of what real world data processing might be like, and the importance of creating datasets that can be easily manipulated. There was a lot of heavy lifting on both the iOS side, which I used basically as a GUI, and the backend data processing side.
My initial motivation for this project was twofold – I wanted to create something that I could see somebody actually using, and I also happened to come upon NYC’s Open Data. NYC Open Data has a ton of data about the city and I wanted to be able to put that information into something that somebody could actually find useful.
As I was walking around NYC, I happened to notice a street where there were three parking signs stacked on top of each other, and it was incredibly confusing to try and read. Imagine how confusing it would be for somebody driving and squinting at all these signs, trying to read them! I wanted to make an app that would make it easy to decipher the parking process.
I looked on the app store, and there were a few apps similar to what I wanted to make. However, either they were incomplete and only listed parking garages, or they were really old and had very outdated graphics. So, I decided to make my own app. I’d have practice using a ton of different areas of iOS, and (I didn’t realize this at first) I’d have a lot of practice processing data.
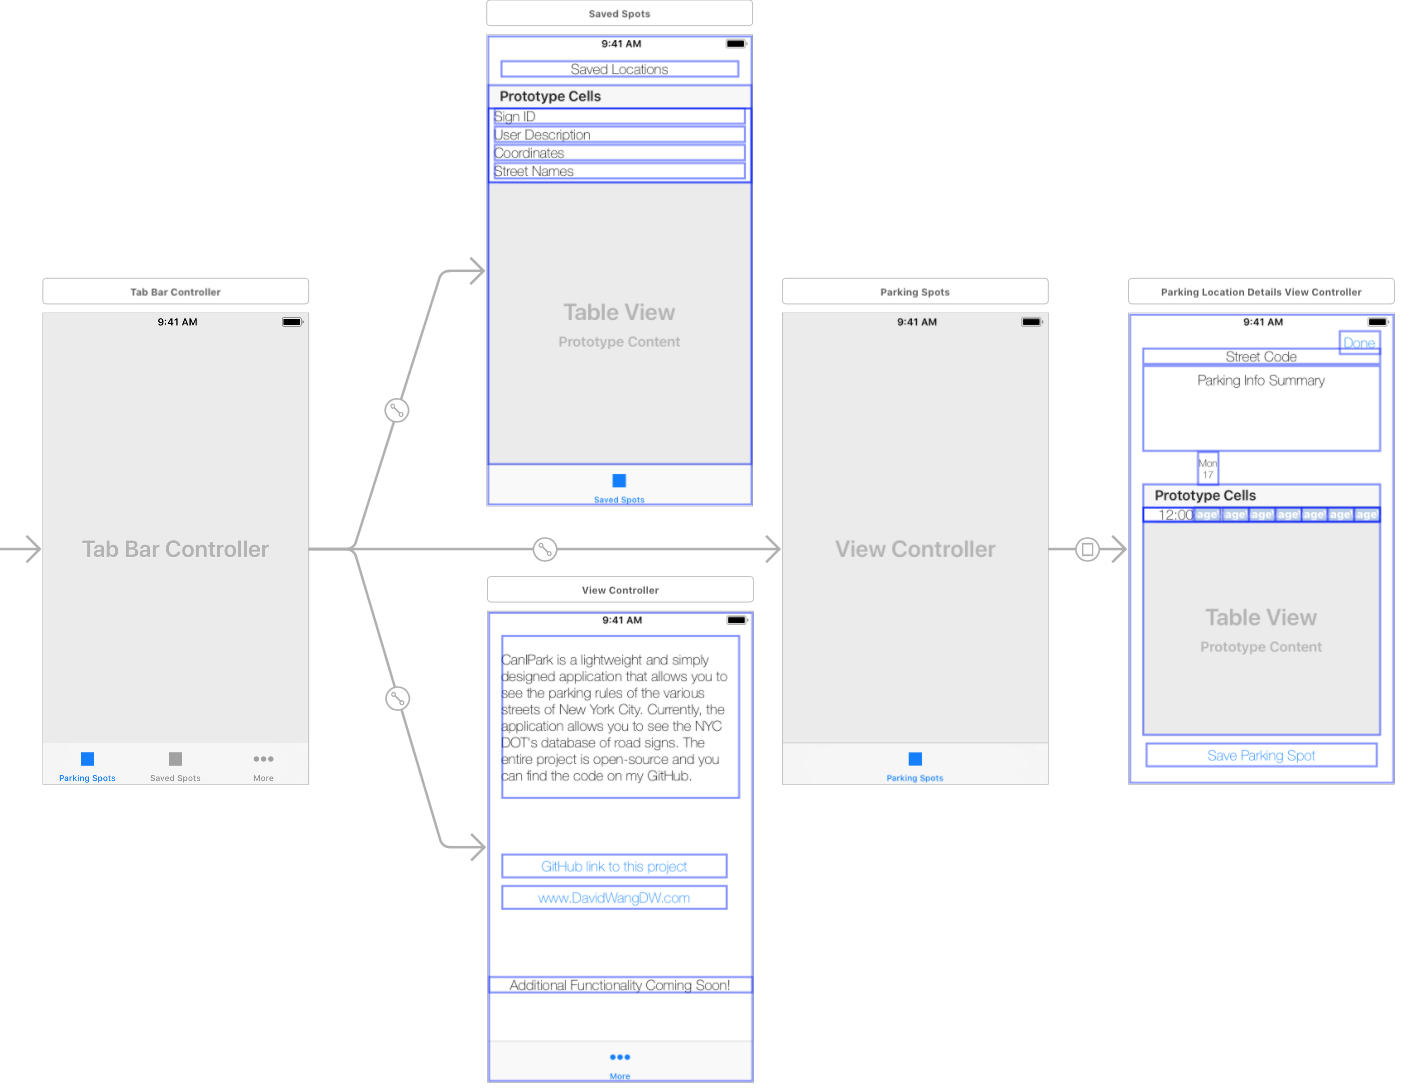
The first part, integrating the Google Maps API into my project, wasn’t that difficult. Google has some pretty good documentation on how to use their APIs. I had it set up as one of my view controllers and set the default location to New York.
Now, I needed to actually get the data ready. NYC provided the sign data in a “SHP” file, which, after some looking online, could be converted to GeoJSON. The data set was too big to be converted easily by any desktop software I could find, so I ended up having to pay an online service for the conversion (website here). This is what the GeoJSON data looked like. You can see all the different tags and information available. The important parts we wanted are the coordinates and description, represented by the "x", "y", and "SIGNDESC1" keys.
{
"type": "FeatureCollection",
"crs": { "type": "name", "properties": { "name": "urn:ogc:def:crs:OGC:1.3:CRS84" } },

"features": [
{ "type": "Feature", "properties": { "OBJECTID": 18134283, "SG_KEY_BOR": "S", "SG_ORDER_N": "P-273491", "SG_SEQNO_N": "3", "SG_MUTCD_C": "SP-10B", "SR_DIST": "0014", "SG_SIGN_FC": null, "SG_ARROW_D": null, "x": 928523.268594, "y": 130507.165873, "SIGNDESC1": "NO STANDING ANYTIME" }, "geometry": { "type": "Point", "coordinates": [ -74.200448927790191, 40.524712217612922 ] } },
{ "type": "Feature", "properties": { "OBJECTID": 18134284, "SG_KEY_BOR": "S", "SG_ORDER_N": "P-273491", "SG_SEQNO_N": "4", "SG_MUTCD_C": "SP-10BA", "SR_DIST": "0050", "SG_SIGN_FC": null, "SG_ARROW_D": "S", "x": 928507.872299, "y": 130539.713052, "SIGNDESC1": "NO STANDING ANYTIME (SINGLE ARROW)" }, "geometry": { "type": "Point", "coordinates": [ -74.200504576004448, 40.524801456655169 ] } },
{ "type": "Feature", "properties": { "OBJECTID": 18134285, "SG_KEY_BOR": "S", "SG_ORDER_N": "P-273491", "SG_SEQNO_N": "5", "SG_MUTCD_C": "R7-125RA", "SR_DIST": "0050", "SG_SIGN_FC": null, "SG_ARROW_D": "N", "x": 928507.872299, "y": 130539.713052, "SIGNDESC1": "1 HOUR PARKING 8AM-7PM EXCEPT SUNDAY (ARROW)" }, "geometry": { "type": "Point", "coordinates": [ -74.200504576004448, 40.524801456655169 ] } },
{ "type": "Feature", "properties": { "OBJECTID": 18134286, "SG_KEY_BOR": "S", "SG_ORDER_N": "P-273491", "SG_SEQNO_N": "6", "SG_MUTCD_C": "R7-125A", "SR_DIST": "0143", "SG_SIGN_FC": null, "SG_ARROW_D": "S", "x": 928467.690949, "y": 130623.591165, "SIGNDESC1": "1 HOUR PARKING 8AM-7PM EXCEPT SUNDAY (ARROW)" }, "geometry": { "type": "Point", "coordinates": [ -74.200649799011956, 40.525031433433576 ] } },
{ "type": "Feature", "properties": { "OBJECTID": 18134287, "SG_KEY_BOR": "S", "SG_ORDER_N": "P-273491", "SG_SEQNO_N": "7", "SG_MUTCD_C": "SP-477B", "SR_DIST": "0253", "SG_SIGN_FC": null, "SG_ARROW_D": null, "x": 928418.682845, "y": 130722.070955, "SIGNDESC1": "BUS STOP SIGN (BUS & HANDICAP SYMBOLS) NO STANDING" }, "geometry": { "type": "Point", "coordinates": [ -74.200826893396865, 40.525301433281939 ] } },
{ "type": "Feature", "properties": { "OBJECTID": 18134288, "SG_KEY_BOR": "S", "SG_ORDER_N": "P-273491", "SG_SEQNO_N": "8", "SG_MUTCD_C": "SP-612BA", "SR_DIST": "0253", "SG_SIGN_FC": null, "SG_ARROW_D": "N", "x": 928418.682845, "y": 130722.070955, "SIGNDESC1": "NO STANDING W\/ SINGLE ARROW (TIMES & DAY(S) TO BE SPECIFIED) (THIS SIGN IS TO BE USED ONLY WITH THE CIRCULAR TYPE BUS SIGNS)" }, "geometry": { "type": "Point", "coordinates": [ -74.200826893396865, 40.525301433281939 ] } }
}
# this file will be used to parse through the geoJSON data given to us by NYC DOT
# preprocessing this will avoid the slowdown on the actual iOS app end
#
# We need five pieces of information:
# 1. The street sign ID number, shown as SG_ORDER_N
# 2. The latitude, shown in the coordinates
# 3. The longitude, shown in the coordinates
# 4. The actual sign description, shown as SIGNDESC1
# 5. The object ID, used to create the dict, shown as OBJECTID
# We will also include the starting and ending points of the signs on the block
# David Wang

import json
from collections import defaultdict

with open('CanIPark/parkingData.geojson') as data_file:
    data = json.load(data_file)

d = defaultdict(list)

for feature in data['features']:

    d[feature['properties']['SG_ORDER_N']].append([feature['properties']['OBJECTID'],feature['properties']['SIGNDESC1'], feature['geometry']['coordinates']])

for key in d:

    latitudeStart = d[key][0][2][1]
    latitudeEnd = d[key][0][2][1]
    longitudeStart = d[key][0][2][0]
    longitudeEnd = d[key][0][2][0]

    for sublist in d[key]:
        if sublist[2][1] < latitudeStart:
            latitudeStart = sublist[2][1]
            longitudeStart = sublist[2][0]
        if sublist[2][1] > latitudeEnd:
            latitudeEnd = sublist[2][1]
            longitudeEnd = sublist[2][0]

    d[key].append([[latitudeStart, longitudeStart], [latitudeEnd, longitudeEnd]])

with open('JSONData.json', 'w') as f:
    json.dump(d, f)
{
"P-373583": [
            [18134300, "2 HOUR METERED PARKING 8AM-7PM EXCEPT SUNDAY", [-74.13635949265111, 40.63348503435664]],
            [18134301, "NO STANDING ANYTIME", [-74.13614689557281, 40.63379371086361]],
            [18134302, "2 HOUR METERED PARKING 8AM-7PM EXCEPT SUNDAY",[-74.13614689557281, 40.63379371086361]],

"P-287887": [
            [18134296, "1 HOUR METERED PARKING 8AM-7PM EXCEPT SUNDAY", [-74.13180531230859, 40.61307213814113]],
            [18134297, "NO PARKING ANYTIME", [-74.13208827683376, 40.61323401176669]],
            [18134298, "1 HOUR METERED PARKING 8AM-7PM EXCEPT SUNDAY", [-74.13208827683376, 40.61323401176669]],
            [18134299, "NO PARKING ANYTIME", [-74.13208827683376, 40.61323401176669]]]
}
So, project finished, right? Well, the basic functionality was there. I had a list of signs and they were plotted on a map. However, the data is a bit messy – we knew where the signs were, but the descriptions were a bit cryptic. So this got me thinking – is there a better way of processing the data?
I went in depth to look at the data. There were a lot of problems. The data looked like it had been entered by hand, which meant confusing language, the occasional typo, and no good way for a machine to read it. So now I had to take each description, find a good way to parse the useful information out of it, and then store it in something that’s easy to read.
To parse the sign descriptions, I had to turn to an old enemy: regular expressions. I had read about them briefly before but I never put them into use. Now, looking at some tutorials online, I thought I was in over my head. After several headaches, I eventually managed to figure them out. Not actually that scary!
Now, my goal was to grab three key pieces of information out of each sign description:
- The overall sign rule (no parking, hourly parking, metered parking, free parking, etc)
- The days which the rule applied
- The times which the rule applied
The most difficult part is to extract a sign rule, since there are so many different kinds of rules (and this is where all the typos come in).
Next Steps
That’s as far as I am now. I have some next steps I want to complete: